
Designing Usable and Effective Business Dashboards
Designing Usable and Effective Business Dashboards, available at $64.99, has an average rating of 3.95, with 64 lectures, based on 22 reviews, and has 65 subscribers.
You will learn about You will be able to add "Dashboard Design Expert" in your profile. You will be able to execute "dashboard design" projects from scratch to delivery. You will be able to articulate and "ask right questions" to your clients / stakeholders strenthening their confidence in your expertise. You will be able to prove that "you are capable" of driving design projects in right direction. Identify type of dashboard needed for your clients requirement. Apply UX methodology step by step in a real world business situation from user research to dashboard delivery. Secret to Dashboard Success: Convert raw data into actionable insights. Basics of User Centered Design (UCD) and difference between UX and UCD. Real life design exercise as a warm-up session. You can send your designs for feedback & comments. Creating Design Strategy which will provide design directions for dashboard. How to take User Interviews and eliciting insights from it. How to create user persona from user research. Working with wireframing and interactive prototyping software "Axure RP". (It is used by more than 25,000 organizations around the world including 87 of the Fortune 100) Designing quick concept sketches for ideation. Designing high – fidelity interactive business dashboard prototypes in Axure. Understanding information visualization and its impact on dashboard design. Improving dashboard presentation by working on Layout, Color, Font and Icons. Test dashboards with your users (Usability Testing) to check if it really works! Bundling your design deliverables and presenting it to your client. Impress your client by showing systematic translation of user research into intuitive dashboards. 45 well-structured lectures with step by step content. Free downloadable templates on Design Strategy, User Persona, Visualization Selection, Dashboard Layouts etc. Dashboard Presentation PRO Tips. Detailed "User Interview Protocol" to help you kick start user interviews. Last but not the least, full time proactive support from myside to ensure that you get value for money 🙂 This course is ideal for individuals who are New or established business owners who want to track various aspects of their business performance. or UX designers who want to enhance their scope of expertise. or Developers who work with Tableau, Power BI, or any other analytics platform and would want to bring User Centered Design aspect in their work. or Business Analysts who want to know how User Centered Design method can help them create usable business dashboards. or Students / beginners who want to learn UX, its process, and want to implement research into design practically in real life business situation. or Freelancers who are dealing with “dashboard” projects and aim to bring more ROI for their client. It is particularly useful for New or established business owners who want to track various aspects of their business performance. or UX designers who want to enhance their scope of expertise. or Developers who work with Tableau, Power BI, or any other analytics platform and would want to bring User Centered Design aspect in their work. or Business Analysts who want to know how User Centered Design method can help them create usable business dashboards. or Students / beginners who want to learn UX, its process, and want to implement research into design practically in real life business situation. or Freelancers who are dealing with “dashboard” projects and aim to bring more ROI for their client.
Enroll now: Designing Usable and Effective Business Dashboards
Summary
Title: Designing Usable and Effective Business Dashboards
Price: $64.99
Average Rating: 3.95
Number of Lectures: 64
Number of Published Lectures: 64
Number of Curriculum Items: 64
Number of Published Curriculum Objects: 64
Original Price: $64.99
Quality Status: approved
Status: Live
What You Will Learn
- You will be able to add "Dashboard Design Expert" in your profile.
- You will be able to execute "dashboard design" projects from scratch to delivery.
- You will be able to articulate and "ask right questions" to your clients / stakeholders strenthening their confidence in your expertise.
- You will be able to prove that "you are capable" of driving design projects in right direction.
- Identify type of dashboard needed for your clients requirement.
- Apply UX methodology step by step in a real world business situation from user research to dashboard delivery.
- Secret to Dashboard Success: Convert raw data into actionable insights.
- Basics of User Centered Design (UCD) and difference between UX and UCD.
- Real life design exercise as a warm-up session. You can send your designs for feedback & comments.
- Creating Design Strategy which will provide design directions for dashboard.
- How to take User Interviews and eliciting insights from it.
- How to create user persona from user research.
- Working with wireframing and interactive prototyping software "Axure RP". (It is used by more than 25,000 organizations around the world including 87 of the Fortune 100)
- Designing quick concept sketches for ideation.
- Designing high – fidelity interactive business dashboard prototypes in Axure.
- Understanding information visualization and its impact on dashboard design.
- Improving dashboard presentation by working on Layout, Color, Font and Icons.
- Test dashboards with your users (Usability Testing) to check if it really works!
- Bundling your design deliverables and presenting it to your client.
- Impress your client by showing systematic translation of user research into intuitive dashboards.
- 45 well-structured lectures with step by step content.
- Free downloadable templates on Design Strategy, User Persona, Visualization Selection, Dashboard Layouts etc.
- Dashboard Presentation PRO Tips.
- Detailed "User Interview Protocol" to help you kick start user interviews.
- Last but not the least, full time proactive support from myside to ensure that you get value for money 🙂
Who Should Attend
- New or established business owners who want to track various aspects of their business performance.
- UX designers who want to enhance their scope of expertise.
- Developers who work with Tableau, Power BI, or any other analytics platform and would want to bring User Centered Design aspect in their work.
- Business Analysts who want to know how User Centered Design method can help them create usable business dashboards.
- Students / beginners who want to learn UX, its process, and want to implement research into design practically in real life business situation.
- Freelancers who are dealing with “dashboard” projects and aim to bring more ROI for their client.
Target Audiences
- New or established business owners who want to track various aspects of their business performance.
- UX designers who want to enhance their scope of expertise.
- Developers who work with Tableau, Power BI, or any other analytics platform and would want to bring User Centered Design aspect in their work.
- Business Analysts who want to know how User Centered Design method can help them create usable business dashboards.
- Students / beginners who want to learn UX, its process, and want to implement research into design practically in real life business situation.
- Freelancers who are dealing with “dashboard” projects and aim to bring more ROI for their client.
Can you improve something without measuring it? No. Right?
This is why we need business dashboards to measure and improve business performance, producing real business ROI.
For most of the people, more often than not, aesthetic beauty takes the front seat and becomes the only parameter to justify better designs. Thanks to Steve Jobs who shattered this myth by quoting – “Design is not just what it looks like and feels like. Design is how it works!“
Business dashboards are not foreign to this concept. We have many sophisticated tools which let us create business dashboards in minutes, but rarely we think about it’s usefulness in business context. We forget that developer who is building the dashboard is not the person who is actually going to consume it. We neglect User Centered Design process while designing business dashboards.
And the result? We end up designing “Instinct Based Subjective Design” which hardly provides any value. This course takes you on a journey of creating “Research Based User Centric Objective Design” which provides true ROI to your client.
This course will teach you everything you need to know about user research, design strategy, design conceptualization, wire framing, prototyping and testing it with your end users to make sure it really works! You will learn all this from scratchso it doesn’t matter how much experience you have when you take up this course.
In this 64 well-structured video lecture series, we will start with understanding a real life business challenge. I will give you an opportunity to perform a design exercise and I can provide you the feedback on the same. This will help you understand what I mean by “Instinct based subjective design”. Then we will proceed on with learning how to take user interviews effectively and how to elicit design key pointers from it. We will create a systematic design strategy to achieve our business goal. We will create user persona to better understand our user and feed all these research insights practically onto paper to create concept sketches for dashboard. We will refine concept sketch step by step focusing on visualizations, layout, font, color, icons etc. until we reach our close to perfect dashboard. (Because in reality, there is nothing like perfect design 🙂
Hey, we are not going to stop yet! We will test our dashboard with real users to understand if it really works! And in last, we are to show you how to bundle your deliverables and help your team members consume all this stuff along the way.
This course will help you in converting raw business data into actionable insights.
This course will help you in analyzing and communicating business information effectively for quality decision making.
So what are you waiting for? Join me in this exciting and rewarding journey of effective business dashboard design!
Course Curriculum
Chapter 1: Course Introduction
Lecture 1: Welcome to the course
Lecture 2: Humanizing business dashboards
Lecture 3: Dashboard challenges in current scenario & course structure
Lecture 4: Who all can take this course?
Lecture 5: How to take this course?
Chapter 2: Some theory about dashboards
Lecture 1: Dashboard definition
Lecture 2: History and evolution of dashboards
Lecture 3: Types of dashboards
Lecture 4: Summary
Chapter 3: Sample Exercise
Lecture 1: Let's start with a real life story!
Lecture 2: Data available
Lecture 3: Dashboard Design Activity
Lecture 4: Reviewing sample dashboard designs
Lecture 5: Summary
Chapter 4: Introduction to User Experience (UX) Design
Lecture 1: Introduction
Lecture 2: What is User Experience (UX) ?
Lecture 3: What is User Centered Design (UCD) ?
Lecture 4: Relation between UX and UCD
Lecture 5: Implementing UCD in Business Dashboards
Lecture 6: UX Desing Process
Lecture 7: Summary
Chapter 5: Design Strategy
Lecture 1: Sales Dashboard Case Study – Revisited
Lecture 2: What is Design Strategy?
Lecture 3: Elements of Design Strategy
Lecture 4: Sales Dashboard Design – A case study
Lecture 5: Sharing Design Strategy
Lecture 6: Summary
Chapter 6: User Research
Lecture 1: intro
Lecture 2: Conducting User Interviews
Lecture 3: Sales Dashboard Case Study: Research Analysis
Lecture 4: Sales Dashboard Case Study: Design Strategy Revisited
Lecture 5: What is User Persona ?
Lecture 6: Creating user persona
Lecture 7: Sales Dashboard (CFO) – Persona
Lecture 8: Summary
Chapter 7: Design
Lecture 1: Introduction to Axure RP
Lecture 2: Designing basic interactions – Part 1
Lecture 3: Designing basic interactions – Part 2
Lecture 4: Axure RP – Help and Support
Lecture 5: Designing concept sketches
Lecture 6: Concept Sketch – Sales dashboard
Lecture 7: High fidelity wireframes
Lecture 8: Summary
Chapter 8: Information Visualization
Lecture 1: Introduction
Lecture 2: What is Information Visualization ?
Lecture 3: Types of Information Visualization
Lecture 4: How to avoid selecting wrong visualization ?
Lecture 5: Journey from raw data to actionable insight
Lecture 6: Information Visualization – Sales Dashboard Case Study
Lecture 7: Summary
Chapter 9: Presentation
Lecture 1: Introduction
Lecture 2: Gestalt Principle
Lecture 3: Layout
Lecture 4: Color
Lecture 5: Icon
Lecture 6: Font
Lecture 7: Design Progression Summary
Chapter 10: Testing and Delivering Design
Lecture 1: Testing our design
Lecture 2: Usability Testing (UT)
Lecture 3: UI Style Guide
Lecture 4: UX Deliverables
Lecture 5: A big Thank You!
Chapter 11: Bonus Giveaways!
Lecture 1: Bonus Giveaways
Chapter 12: Be in touch.. Bye Bye!
Lecture 1: Be in touch.. Bye Bye!
Instructors
-

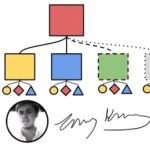
Anurag Sharma
CUA, CXA certified UX designer
Rating Distribution
- 1 stars: 1 votes
- 2 stars: 1 votes
- 3 stars: 5 votes
- 4 stars: 6 votes
- 5 stars: 9 votes
Frequently Asked Questions
How long do I have access to the course materials?
You can view and review the lecture materials indefinitely, like an on-demand channel.
Can I take my courses with me wherever I go?
Definitely! If you have an internet connection, courses on Udemy are available on any device at any time. If you don’t have an internet connection, some instructors also let their students download course lectures. That’s up to the instructor though, so make sure you get on their good side!
- Start Your Own Business: From Startup Idea to Product Launch

- Agile, Scrum & Kanban Practice Tests & Interview Questions

- Should I Start a Home Care Agency?

- Customer Segmentation Analytics Masterclass 2024

- Amazon FBA&Dropshipping Suspension Prevention Course (2023)

- How To Finance Deals With Little To No Money Out Of Pocket

- Transport and Mobility Decarbonisation & Energy Transition

- Project Management Professional (PMP) 6th edition PMBOK

- Building Better Programs: The Training Cycle

- Professional Email Writing in English: Complete Training

- Create & Sell – Finding your IDEAL CUSTOMER

- ESG Reporting

- FOOD SAFETY Exam Questions Practice Test

- PMI's Disciplined Agile Coach- Practice Exam

- Business the Hard Way Vol 1: Sales the Hard Way
- Using & Interpreting CamelCamelCamel & Keepa Charts For FBA
- Brand Identity Breakthrough: Make Your Products Irresistible

- Webinar Mastery – Sell High Ticket Products!

- How to Draft Privacy policy & Terms of Use for your website

- Be The Best In Overcoming Sales Objections!