Google Data Studio from Beginner to Advanced
Google Data Studio from Beginner to Advanced, available at $44.99, has an average rating of 4.3, with 28 lectures, based on 83 reviews, and has 1083 subscribers.
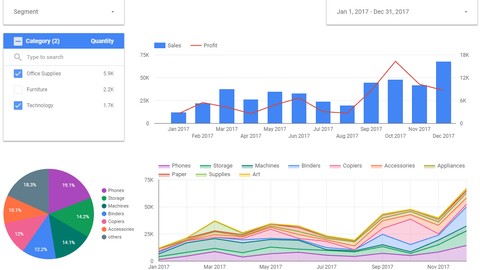
You will learn about Create reports, charts and dashboards Use different types of charts and reports Analyze more parameters inside one chart or report Compare current performance with previous period or other historical data Use different Filters or Data Ranges for whole report or just defined group of objects Analyze the market share with Pie charts or Area Charts Use the Geo maps to analyze the Sales location Use Pivots to analyze data through matrix view Emphasize the result with heatmaps and colored bars Use the grouping to show different stories on one report or page Share the report with defined rules Embed the report to the Websites or Intranet Create calculated fields with various formulas This course is ideal for individuals who are Anyone who wants to create amazing reports, charts and dashboards with no additional costs or Business owners, Managers, Data Analysts It is particularly useful for Anyone who wants to create amazing reports, charts and dashboards with no additional costs or Business owners, Managers, Data Analysts.
Enroll now: Google Data Studio from Beginner to Advanced
Summary
Title: Google Data Studio from Beginner to Advanced
Price: $44.99
Average Rating: 4.3
Number of Lectures: 28
Number of Published Lectures: 28
Number of Curriculum Items: 28
Number of Published Curriculum Objects: 28
Original Price: $64.99
Quality Status: approved
Status: Live
What You Will Learn
- Create reports, charts and dashboards
- Use different types of charts and reports
- Analyze more parameters inside one chart or report
- Compare current performance with previous period or other historical data
- Use different Filters or Data Ranges for whole report or just defined group of objects
- Analyze the market share with Pie charts or Area Charts
- Use the Geo maps to analyze the Sales location
- Use Pivots to analyze data through matrix view
- Emphasize the result with heatmaps and colored bars
- Use the grouping to show different stories on one report or page
- Share the report with defined rules
- Embed the report to the Websites or Intranet
- Create calculated fields with various formulas
Who Should Attend
- Anyone who wants to create amazing reports, charts and dashboards with no additional costs
- Business owners, Managers, Data Analysts
Target Audiences
- Anyone who wants to create amazing reports, charts and dashboards with no additional costs
- Business owners, Managers, Data Analysts
This course will lead you from Basic to Advanced level. You will be able to create amazing reports, graphs and analysis. You will understand how to create any type of chart, table or dashboard. You will be able to prepare valuable analysis to understand the story of your business. The course contains practical training assignments so you can develop your knowledge by practice. Links to the Data, Assignments & Results are available in Bonus Section.
Course Curriculum
Chapter 1: Introduction
Lecture 1: Introduction
Chapter 2: How to approach Google Data Studio training
Lecture 1: How to use this course
Chapter 3: Google Data Studio Beginners
Lecture 1: Create the Report
Lecture 2: Report’s menu and options
Lecture 3: Create first table
Lecture 4: Modify the report & define report level objects
Lecture 5: Create simple Bar Chart
Lecture 6: Use the Combo Chart to see more parameters
Lecture 7: Use Filters & Date Ranges
Lecture 8: Use Time Series Chart to compare historical data
Chapter 4: Google Data Studio Intermediate
Lecture 1: Use Date Range filter to let users modify it
Lecture 2: Use Filter Control to allow deeper analysis by the user
Lecture 3: Use the Pie chart to see the market share
Lecture 4: Use the Area chart to show the market share in time series
Lecture 5: Use the Geo Map to analyze the sales location
Lecture 6: Use the Scorecard to compare the results
Lecture 7: Use the Bullet Chart to compare result and target
Lecture 8: Use the Pivot table for matrix view
Lecture 9: Use the Heatmap and Bars to emphasize the data differences
Chapter 5: Google Data Studio Advanced
Lecture 1: Use the grouping to show different stories in one page
Lecture 2: Arrange the layout consistency
Lecture 3: Share the Report
Lecture 4: Enable Custom bookmark link to the user
Lecture 5: Embed the report to Websites or Intranet
Lecture 6: Create simple calculated field
Lecture 7: Create calculated field as a duration between two dates
Lecture 8: Create calculated field with Conditional function
Chapter 6: Bonus section
Lecture 1: Bonus Lecture
Instructors
-

Tony Hat
Manager & IT Solutions expert
Rating Distribution
- 1 stars: 2 votes
- 2 stars: 4 votes
- 3 stars: 15 votes
- 4 stars: 34 votes
- 5 stars: 28 votes
Frequently Asked Questions
How long do I have access to the course materials?
You can view and review the lecture materials indefinitely, like an on-demand channel.
Can I take my courses with me wherever I go?
Definitely! If you have an internet connection, courses on Udemy are available on any device at any time. If you don’t have an internet connection, some instructors also let their students download course lectures. That’s up to the instructor though, so make sure you get on their good side!
- Renewable Energy: Practical Introduction to Biogas and AD

- Agile With Scrum Master Class: Advanced Techniques

- The Complete WordPress Amazon Affiliate course

- GDPR Hands-On Quick Start for Decision Makers in Business

- How to become a published author

- Crypto Class On The Road (Altcoins, Exchanges, Bullruns)

- Leadership in Emergency Management

- LEED Green Associate V4 Exam | 4 Full Practice Tests

- Learn Importance of Business Law for Beginner Entrepreneur

- Google Data Studio – Master the Advanced Concepts

- Customer Service Training

- Fundamentals of Plastics and Polymers

- 2024 Amazon FBA Private Label Playbook – Ultimate Roadmap

- Overview of the oil and gas industry

- Introduction to Business Accounting

- MagicCandleStrategy: Advanced Strategy for Intraday Trading

- Human Resources Fundamentals

- Canva Sales Funnels Made Easy

- Third-Party Risk Management (TPRM)

- Leadership Skills: Different Personality Types: Influencing